
Stock Valuation: What Actually Works?


Stock valuation assesses whether a stock is overvalued, undervalued, or fairly priced in the market. It estimates the intrinsic value of a company or stock, and there are several ways to do it.
Is Stock Valuation a Necessity?
I’ll get straight to the point: I don’t believe you must include valuation calculations in your investment process. However, this doesn’t mean stock valuation is entirely useless. In fact, from time to time, this part of your investment process will help you isolate hidden gems and profit from your research.
Stock valuation is closer to fortune-telling than science
Here’s my point about stock valuation:
- Several stock valuation methods will bring you various results.
- Each method will require you to make assumptions (cash flow, dividend, earnings growth, etc.).
- Each assumption will include your best guess.
- Each guess will lead to a different result.
- Depending on your feelings, you may find a bargain where I might see you greatly overpaid for a stock.
Here are two examples from Refinitiv’s analysts’ target price database (August 17, 2021).
*For this example, I’ve picked two companies I like and have in my portfolio. Similar results are a pure coincidence.
Alimentation Couche-Tard (ATD.TO) price as of August 17, 2021: $51.75
- Lowest 12-month target price: $45.00 (-12.55%)
- Highest 12-month target price: $65.00 (+26.31%)
- Mean (15 analysts): $55.00 (+6.88%)
Apple (AAPL) price as of August 17, 2021: $150.52
- Lowest 12-month target price: $132 (-12.65%)
- Highest 12-month target price: $190.00 (+25.73%)
- Mean (40 analysts): $165.87 (+9.76%)
Both companies show a potential range between -12.5% and +26% with a “consensus” of +7% for ATD and +10% for Apple.
Should you buy either stock?
Strangely enough, when you look at the “best analysts” (usually right about their price targets), two top analysts see ATD at $62 or $47 and AAPL at $190 or $149. Analysts included most Canadian Banks (for ATD) and major investment firms such as Credit Suisse, HSBC, Raymond James, and Argus.
Fast-forward to August 17th, 2022. Alimentation Couche-Tard traded at $60.11 (+16%), and Apple traded at $173.56 (+15 %).
Pessimistic analysts in both cases were dead wrong, and both investments beat their respective indexes by a wide margin. In fact, holding ATD and AAPL over this period was a blessing. So, were they greatly undervalued?
After looking at what high-level professionals think of both companies, I’m totally confused about how much both stocks will be worth in another 12 months!
Can you make sense of those analysts’ projections?
The thing I dislike the most about stock valuation is that it tends to create doubts in the investor’s mind.
What if I pay too much for this company?
Maybe I should wait and buy when the price goes down.
The price went up another 10%, so am I missing a great opportunity?
You get the picture. For this reason, I’ll never trigger a buy or sell based solely on stock valuation, and it doesn’t mean that I don’t look at the price I pay. It is still worth a shot to look at various valuation methodologies to get a better idea of what price you are really paying when you buy shares.
Skip to My Best Stock Ideas

Each year, I compile a list of stocks expected to do better than the market for Dividend Stocks Rock members. This year, I’ve reviewed the 11 sectors for them and included top picks for each.
I’ve decided to share six cherry-picked stock ideas in three different sectors, all showing a good entry point at the moment of selection.
You can download them right here:
Four Primary Stock Valuation Methods
Many valuation metrics are readily calculated, such as the price-to-earnings ratio, price-to-sales ratio, or price-to-book ratio. But these numbers only hold value with respect to some other form of stock valuation.
The three primary stock valuation methods for evaluating a healthy dividend stock are:
Dividend Discount Model
The Dividend Discount Model (DDM) is a key valuation technique for dividend growth stocks. The most straightforward form of it is called the Gordon Growth Model. This model is used to determine the intrinsic value of a stock based on a future series of dividends that grow at a constant rate. In other words, the model will give you the value to pay today for a stock that will pay and hopefully increase its dividends in the future. Therefore:
- The DDM will work well with stable companies with a relatively high yield (above 3%).
- The DDM will NOT work well with low-yield, high-growth companies (such as Apple).
- The DDM is extremely sensitive to the dividend growth rate and discount rate. A 1% change could make the difference between an overvalued stock and the bargain of the year.
The number you obtain from the DDM calculation is just the value of future dividends. If you expect some capital growth (as you should), it will not be included in your results. Therefore, I like to use the DDM approach to compare two or more companies operating in the same sector. This strategy is quite helpful in finding the “best” dividend grower among companies that look very similar in all other respects.
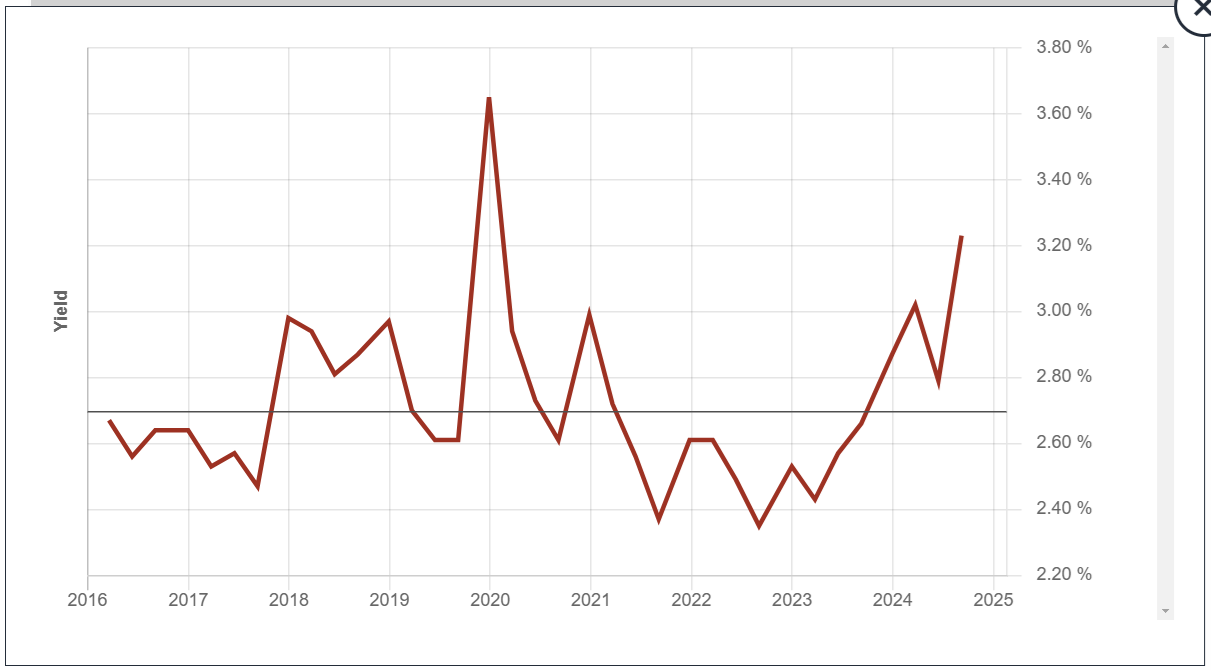
Dividend Yield History
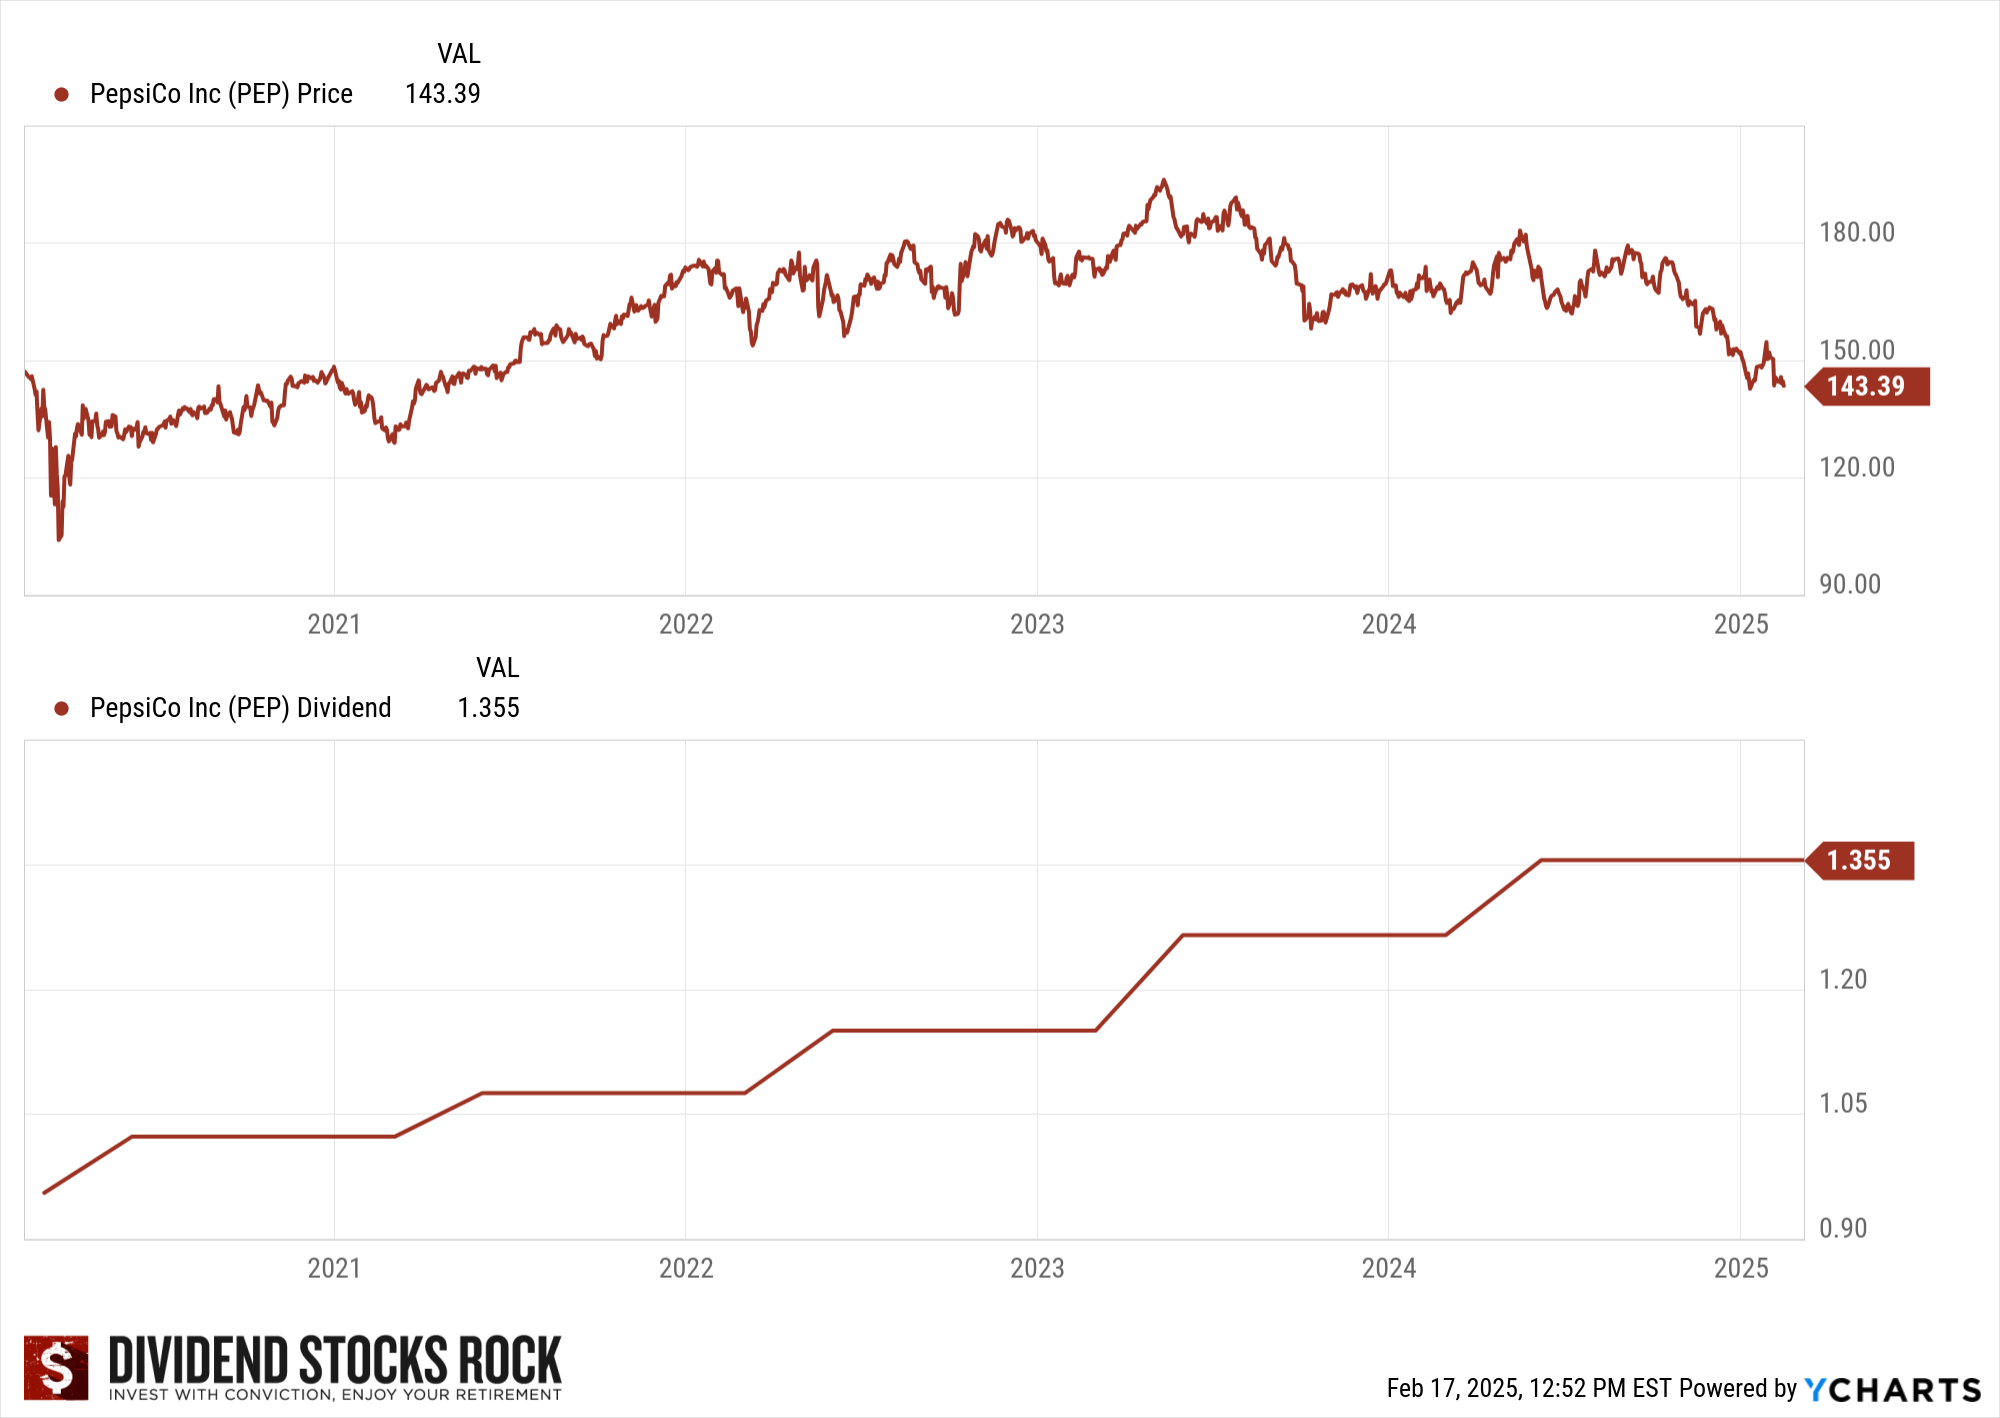
A simple but effective tool is to look at a company’s dividend yield history. For this example, we’ll use PepsiCo (PEP).
The dividend yield may move for two primary reasons:
- The dividend increases at a faster pace than the stock price.
- The stock price decreases, and the dividend increases or remains intact.
In both cases, you should investigate to know if:
- A) there is a buying opportunity or
- B) there is a selling opportunity.
When you look at the past 5 years of dividend yield history, you can discern what the company’s average yield should be. Whenever a company behaves as expected (e.g., continuous growth, stable business model, etc.), the stock price and the dividend are likely to follow a similar trajectory.
In other words, the company will offer a similar yield year after year. There might be a buying opportunity whenever the stock provides you with a better yield. It’s far from being a perfect system, but it gives you a hint about the best time to invest in a particular company.
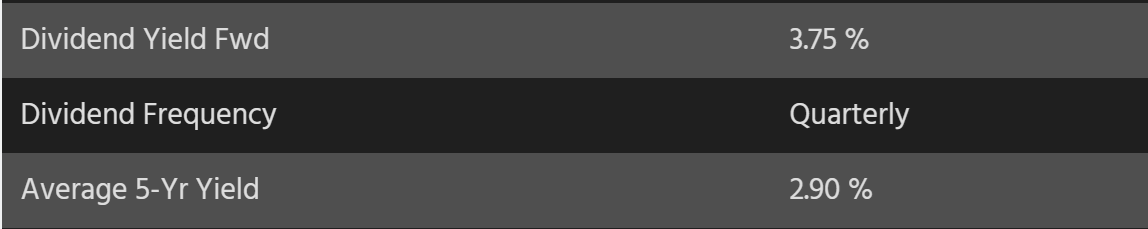
When a stock offers a higher yield (forward dividend yield of 3.75%) than its 5-year average (2.90%), it’s a good indicator of a possible good deal… or something may not be right!
Pepsi saw its yield increase since 2023 while the dividend continued to grow.
You can examine the dividend growth rate for 1 year, 3 years, and 5 years:
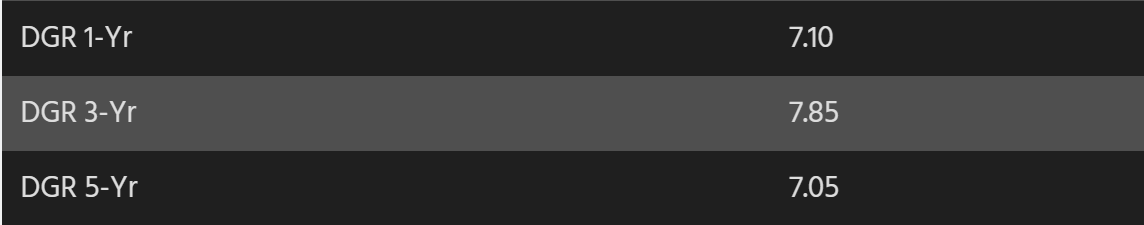
As you can see, Pepsi increases its dividend each year at a similar rate.
Keep in mind this methodology is far from perfect. There are many factors for a company to offer a higher yield and it’s not always because “the market didn’t get it”. If a company is having a hard time finding growth vectors or if its dividend growth policy slows down due to weaker cash flow generation, you are not getting any deals here. More context must be added around any dividend yield increase or decrease.
While PepsiCo has strong fundamentals, it faces risks from shifting consumer preferences, competition, and rising costs.
Earnings Multiple Approach (PE Ratio History & Forward PE)
Like the dividend yield history, looking at a company’s price-earnings ratio history will often help you understand the story of the company’s valuation. A decreasing PE ratio may indicate a good entry price.
Here is Pepsi’s PE ratio graph, showing the past 10 years compared to its average (the gray line).
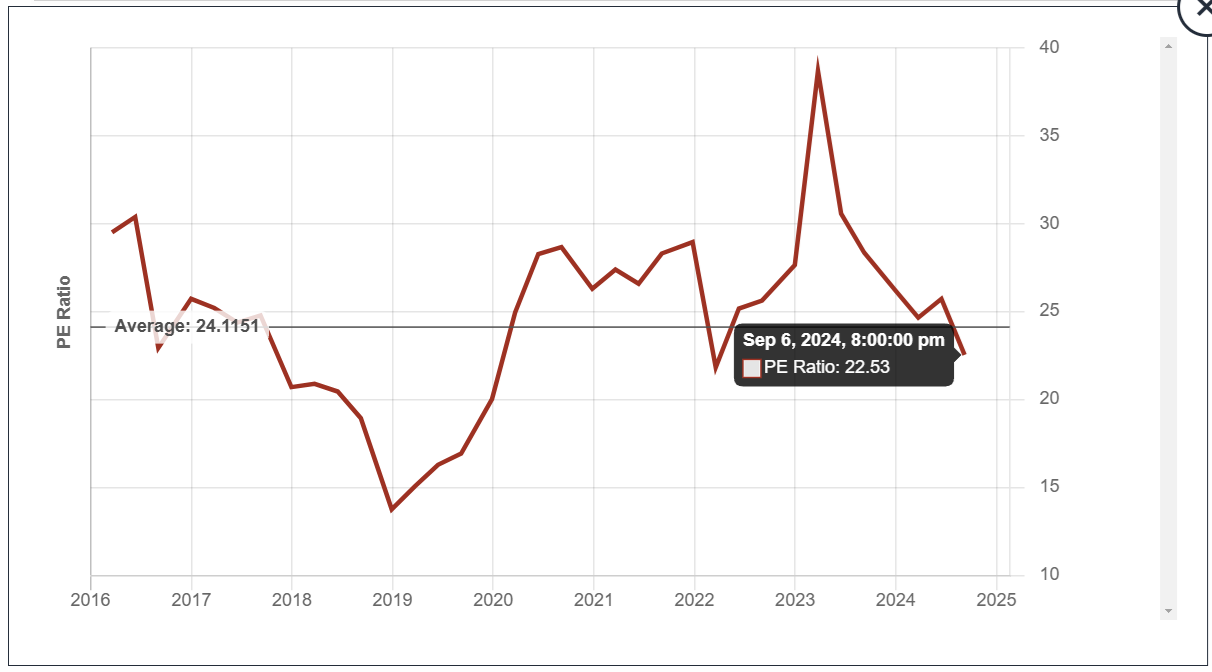
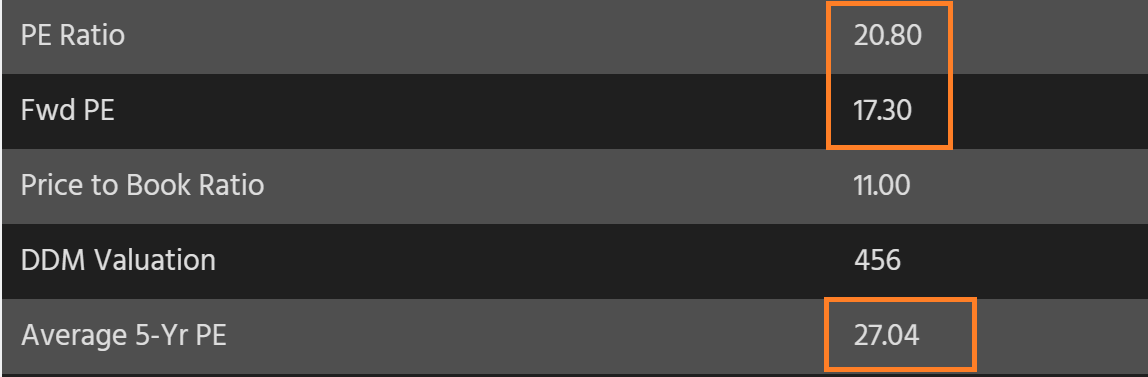
As you will note, the Pepsi PE ratio is a bit hectic and doesn’t tell us much information. However, we can see that the forward PE is lower than the average of the past 5 years:
In summary, a strong valuation does not equal a buy or sell opportunity for both the dividend yield and the PE history. It equals an invitation for further investigation.
Discounted Cash Flow Analysis
The Discounted Cash Flow analysis works exactly like the DDM. In short, the premise of discounted cash flow analysis is that a company is equal to the sum value of all future cash flows, but all those future cash flows must be translated into their value today, and this translation uses the process of discounting.
While discounting the value of future cash flows seems like a solid way to calculate a company’s value, determining what future cash flow will be is quite an adventure!
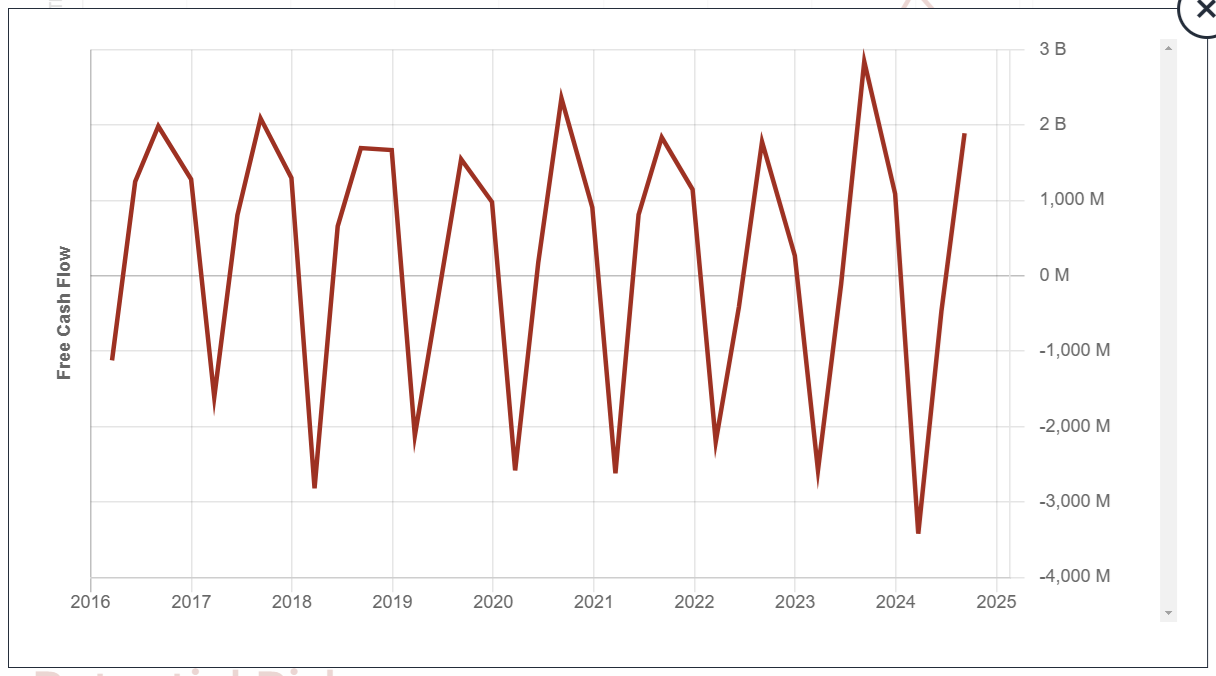
As you can see, PepsiCo’s free cash flow metrics are not the best way to analyze it as they fluctuate significantly (which may reflect business cycles).
Determining this number and its future growth trajectory with precision is almost impossible. You might as well close your eyes and throw a dart!
What Really Works
Investors cannot entirely ignore valuation when they want to put their money to work. However, it doesn’t mean they should let valuation control their investment decisions. I prefer to use stock valuation methods to add more context to my analysis. The highlighted methods will help me by taking two specific actions:
#1 Knowing where to look and what to look for during my analysis
The PE ratio and dividend yield history will tell me much about how the market has viewed the company over the past 5 or 10 years. I will use those graphs to guide my investigation. Thanks to those metrics, I’ll know which year to look for signs of growth or deceleration. Combining a historical graph with the dividend triangle will probably explain why a company saw its stock price move on a continuous rise or decline.
A company with a strong dividend triangle will likely see some PE expansion. Investors will be willing to pay a higher multiple of profits for a company they believe will continue to grow quickly.
Concerns about slow sales or earnings growth could lead to a drop in PE.
#2 Compare companies in the same sector
If I hesitate between a few great companies operating in the same sub-sector, their dividend discount model result will help me identify where I can get the best bang for my buck. Using the DDM, I can compare companies that show a similar dividend growth rate in a similar situation. Therefore, I can use the same discount rate and identify which company offers me the best value for the future dividends received.
A word of caution
Remember that the metrics could tell you a different story if you contextualize them. Sometimes, low valuation metrics may be indicative of a poorly managed company. Never forget that the market anticipates future results while financial metrics tell you what happened in the past. The market is not always correct, yet looking in the rear-view mirror will not tell you what’s coming.
The PE ratio and dividend yield history will tell you more about the past and will tell you what the market expects for the future. The DCF and DDM models will only be as good as your assumptions. A change of 1% could make the difference between a bargain and an overvalued stock. Use your calculator with caution.
Focus on Quality Instead
While this article explains why I don’t mind the price I pay when I purchase a stock, it also highlights how focusing on quality investment gives you the best chances to reach your goals.
 I have used the dividend triangle to create a list of about 300 companies showing growing 5-year revenues, EPS, and dividend trends. The Dividend Rock Stars list is updated monthly and represents a great source to start your dividend stock hunting. Enter your name and email below to get the list in your mailbox.
The post Stock Valuation: What Actually Works? appeared first on Dividend Monk.
Source: https://www.dividendmonk.com/stock-valuation/