
Visualizing The Average American Work Week Over The Past 20 Years

Average weekly working hours typically see a decline during recessions, as employers seek to cut payroll costs during these periods by reducing hours.
However, in recent years, weekly hours have seen a consistent decline despite the U.S. being outside of a recession.
This graphic, via Visual Capitalist’s Kayla Zhu, visualizes the average weekly hours worked by all private employees in the U.S.
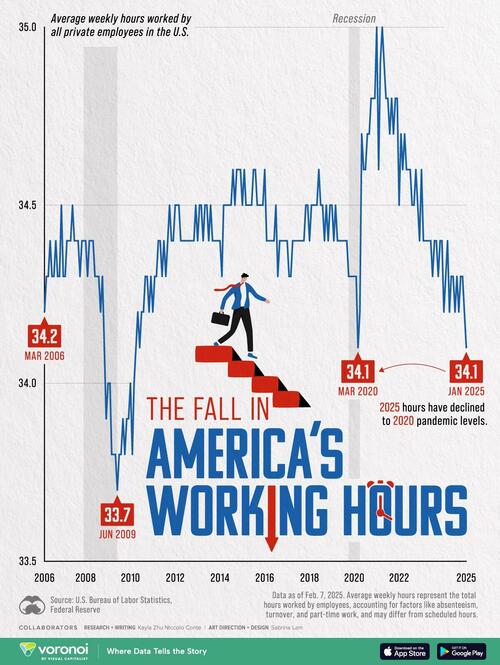
The data comes from the U.S. Bureau of Labor Statistics (BLS) via the Federal Reserve and is updated as of Feb. 7, 2025.
Average weekly hours represent the total hours worked by employees for which pay was received, accounting for factors like unpaid absenteeism, turnover, and part-time work, and may differ from scheduled hours.
Average Weekly Hours Worked Are On the Decline
Below, we show the average weekly hours worked for all U.S. private employees from 2006 to early 2025.
| Date | Average weekly hours worked for all U.S. private employees |
|---|---|
| 2006-03-01 | 34.2 |
| 2006-09-01 | 34.4 |
| 2007-03-01 | 34.4 |
| 2007-09-01 | 34.4 |
| 2008-03-01 | 34.4 |
| 2008-09-01 | 34.2 |
| 2009-03-01 | 33.8 |
| 2009-09-01 | 33.9 |
| 2010-03-01 | 34 |
| 2010-09-01 | 34.3 |
| 2011-03-01 | 34.3 |
| 2011-09-01 | 34.4 |
| 2012-03-01 | 34.5 |
| 2012-09-01 | 34.4 |
| 2013-03-01 | 34.5 |
| 2013-09-01 | 34.4 |
| 2014-03-01 | 34.5 |
| 2014-09-01 | 34.5 |
| 2015-03-01 | 34.5 |
| 2015-09-01 | 34.5 |
| 2016-03-01 | 34.4 |
| 2016-09-01 | 34.4 |
| 2017-03-01 | 34.3 |
| 2017-09-01 | 34.4 |
| 2018-03-01 | 34.5 |
| 2018-09-01 | 34.4 |
| 2019-03-01 | 34.5 |
| 2019-09-01 | 34.4 |
| 2020-03-01 | 34.1 |
| 2020-09-01 | 34.7 |
| 2021-03-01 | 34.9 |
| 2021-09-01 | 34.8 |
| 2022-03-01 | 34.6 |
| 2022-09-01 | 34.5 |
| 2023-03-01 | 34.4 |
| 2023-09-01 | 34.4 |
| 2024-03-01 | 34.4 |
| 2024-09-01 | 34.2 |
| 2025-01-01 | 34.1 |
The average number of weekly hours worked in the U.S. in 2025 has dropped to levels seen during the 2020 pandemic, signaling potential weakness in labor demand.
This decline follows a steady decrease from a peak in 2021.
Sectors Driving the Trend
The BLS attributes this decline to reductions in the retail trade and leisure and hospitality industries, which have faced weaker demand, influenced by shifting consumer behavior post-pandemic, including a decline in in-person shopping and dining.
Despite employment gains since the pandemic low, both these sectors remain below or barely above pre-2020 employment levels, signaling ongoing weakness.
Both these sectors also have trended towards hiring more part-time employees, further contributing to lower weekly hours.
However, the BLS noted that while retail trade and leisure and hospitality saw the greatest recent declines in average weekly hours worked, there has been a broader trend toward slightly reduced average weekly hours across most industries in the United States.
The number of hours worked typically declines during recessions, as seen in both the Great Recession (2008–2009) and the COVID-19 recession (2020). However, the decline during the pandemic was more abrupt and short-lived.
To compare average working hours across the world, check out this graphic that visualizes the average weekly number of hours worked per employee by country.
Tyler Durden Fri, 02/28/2025 – 21:20
Source: https://freedombunker.com/2025/02/28/visualizing-the-average-american-work-week-over-the-past-20-years/
Anyone can join.
Anyone can contribute.
Anyone can become informed about their world.
"United We Stand" Click Here To Create Your Personal Citizen Journalist Account Today, Be Sure To Invite Your Friends.
Before It’s News® is a community of individuals who report on what’s going on around them, from all around the world. Anyone can join. Anyone can contribute. Anyone can become informed about their world. "United We Stand" Click Here To Create Your Personal Citizen Journalist Account Today, Be Sure To Invite Your Friends.
LION'S MANE PRODUCT
Try Our Lion’s Mane WHOLE MIND Nootropic Blend 60 Capsules
Mushrooms are having a moment. One fabulous fungus in particular, lion’s mane, may help improve memory, depression and anxiety symptoms. They are also an excellent source of nutrients that show promise as a therapy for dementia, and other neurodegenerative diseases. If you’re living with anxiety or depression, you may be curious about all the therapy options out there — including the natural ones.Our Lion’s Mane WHOLE MIND Nootropic Blend has been formulated to utilize the potency of Lion’s mane but also include the benefits of four other Highly Beneficial Mushrooms. Synergistically, they work together to Build your health through improving cognitive function and immunity regardless of your age. Our Nootropic not only improves your Cognitive Function and Activates your Immune System, but it benefits growth of Essential Gut Flora, further enhancing your Vitality.

Our Formula includes: Lion’s Mane Mushrooms which Increase Brain Power through nerve growth, lessen anxiety, reduce depression, and improve concentration. Its an excellent adaptogen, promotes sleep and improves immunity. Shiitake Mushrooms which Fight cancer cells and infectious disease, boost the immune system, promotes brain function, and serves as a source of B vitamins. Maitake Mushrooms which regulate blood sugar levels of diabetics, reduce hypertension and boosts the immune system. Reishi Mushrooms which Fight inflammation, liver disease, fatigue, tumor growth and cancer. They Improve skin disorders and soothes digestive problems, stomach ulcers and leaky gut syndrome. Chaga Mushrooms which have anti-aging effects, boost immune function, improve stamina and athletic performance, even act as a natural aphrodisiac, fighting diabetes and improving liver function. Try Our Lion’s Mane WHOLE MIND Nootropic Blend 60 Capsules Today. Be 100% Satisfied or Receive a Full Money Back Guarantee. Order Yours Today by Following This Link.


| Online: | |
| Visits: | 1,682,746,085 |
| Stories: | 8,372,979 |
Whistler Blowers, Insiders
